The journalInstagram Growth
Reach, saves, and the numbers worth reading
Nine numbers show up in Instagram Insights. Three of them repay a weekly look, one of them is worth actively avoiding, and the difference between reach and impressions trips up almost everybody.

In this piece
- 01 What each of your numbers actually counts
- 02 Reach counts people, views count viewings
- 03 The three worth looking at every week
- 04 The follower count is the worst number to check daily
- 05 Compare a post against your own middle post
- 06 When a bad week is only a bad week
- 07 What our software reads, and what it says when it does not know
- 08 Questions people ask about their numbers
Instagram Insights shows you around nine numbers and gives no indication which of them deserve your Tuesday morning. So most people pick the one that is easiest to understand, watch it every day, and end up worse informed than if they had looked at nothing.
Three numbers are worth a weekly look. A few more are worth a monthly one. One is worth checking roughly never, and it is the one almost everybody checks first. Before any of that is useful, though, you need to know what each figure actually counts, because two of them sound identical and are not.
What each of your numbers actually counts
Start here, with no interpretation. The middle column is the definition, the right column is the only thing the number can honestly be used for.
| The number | What it counts | What it can tell you |
|---|---|---|
| Views | Every time the post was played or displayed, repeats by the same person included | Total exposure. Since 2024 this is the headline figure on every format |
| Reach, or accounts reached | Unique accounts that saw it on screen at least once | How many people, as distinct from how many viewings |
| Impressions | Total times the post was seen, with the same account counted more than once | How often people came back to it or scrolled past it twice |
| Likes | Taps on the heart | The cheapest available yes. Almost free to give, so almost free of information |
| Saves | People who filed it to come back to | Whether the post was useful enough that somebody wanted it later |
| Shares, or sends | People who sent it to somebody in a DM, or put it on their story | Whether somebody was willing to spend their own credibility on it |
| Comments | Replies under the post | Whether it asked something, or irritated somebody. Both produce comments |
| Follows from this post | People who followed you after seeing this specific post | Whether the post made a case for the account and not only for itself |
| Profile visits | Taps through from the post to your profile | How many people got curious enough to go and check who you are |
Instagram moves these around and renames them regularly. The definitions hold even when the labels move.
Two rows in that table are the ones that cause trouble, and it is worth slowing down on them.
Reach counts people, views count viewings
Meta's own Business Help Centre defines accounts reached as the number of unique accounts that have seen your content on screen at least once, and impressions as the total number of times your posts have been seen. It states the difference directly: reach is different from impressions, which may include multiple views by the same accounts.
So one person watching your reel four times is one reach and four impressions. Views behave like impressions rather than like reach: repeats count. This means a reel with 40,000 views and 9,000 reach and a reel with 40,000 views and 33,000 reach are two completely different events. The first was watched again and again by a smallish group, which is usually a good sign about the post. The second went out wide and was watched once each, which is usually a good sign about distribution.
- Views Every play or display, with the same person counted every time they came back.
- Impressions Total times it was on somebody's screen. Never fewer than the people, never more than the playings.
- Reach Unique accounts that saw it at least once. This is the only one of the three that counts people.
Definitions from Meta's Business Help Centre, as quoted above. Same reel at 33,000 reach would be the same headline number and a completely different event.
There is a practical consequence. If you only ever read views, you cannot tell growth from repetition, and you will misread the single most important question a small account has, which is whether anything you make is getting outside the group that already follows you.
The three worth looking at every week
Weekly is the right cadence for exactly three numbers. Here they are, with the reason each one earns the slot.
- Shares, or sends. In January 2025 Adam Mosseri told creators that the three signals mattering most for ranking are watch time, likes and sends, and that in your insights you should watch average watch time, likes per reach and sends per reach. Sending a post to a friend is the most expensive thing a viewer can do cheaply: it puts their own judgement on the line in a private conversation. Instagram treats that seriously, and so should you.
- Saves. Instagram has never named saves as one of its top ranking signals, so treat this as an argument about usefulness rather than about distribution. Somebody saving your post is telling you the thing had value beyond the moment they saw it, and that is the closest a public number gets to somebody saying your work was worth keeping.
- Reach. The only one of the three that answers whether you are still reaching beyond the people who already follow you. Watch it as a share of your follower count rather than as a raw number: reach of 40,000 means something very different at 3,000 followers and at 60,000.
Everything else on the list is a monthly or an occasional number. Profile visits and follows-from-a-post are worth reading once a month, together, because they answer a question weekly noise cannot: whether the posts that travel are also the posts that convince. Impressions are worth a look when a post behaves strangely and you want to know whether people watched it twice. Likes are worth almost nothing on their own and are worth a little as a ratio against reach, which is the form Mosseri named.

The follower count is the worst number to check daily
It is the number every new creator watches, and it is close to useless at a daily resolution. It moves for reasons unconnected to anything you did: someone deletes an account, a batch of inactive accounts gets removed, a reel from three weeks ago resurfaces in somebody's feed. Read at a day's resolution, it is almost entirely noise with a slow signal buried inside it.
Instagram's own head has said as much. In April 2024, as reported by Social Media Today, Adam Mosseri argued that follower counts are not a good indicator of an account's value, and he has spent years pushing creators towards reach instead. He runs the company that displays the number, which makes the statement unusually credible: nobody at Instagram benefits from you caring less about a figure the app prints in bold.
There is also a straightforward psychological cost. Checking a slow number quickly is the recipe for demoralisation, because at a daily resolution the number is flat or down about as often as it is up, no matter how well the account is doing. Look at it monthly and it becomes a real signal. Look at it every morning and it becomes a mood.
Compare a post against your own middle post
The most common way people read their numbers is to look up a benchmark and see whether they clear it. Here is the arithmetic behind the most quoted benchmark of all, so you can run it before deciding what it is worth. An engagement rate is normally the interactions on a post divided by your follower count. Likes plus comments, divided by followers, multiplied by a hundred.
Three to six percent. The audience is answering. For an account this size, that is the range brands like to find.
formula: (likes + comments) ÷ followers × 100, averaged over recent posts
Now the parts that number cannot see. It divides by followers while most of a reel's reach may have come from people who do not follow you, so a post that travelled widely can score badly on it. Most versions of the formula count only likes and comments, so saves and sends, the two things Instagram and your own audience care most about, are invisible to it. It says nothing at all about whether anybody followed you afterwards. And on a single post it is noisy enough that a difference of a percentage point means nothing.
Then there is the benchmark problem. Rival IQ's 2025 Social Media Industry Benchmark Report puts the median Instagram engagement rate by follower at 0.36% across all the industries it tracks, with higher education at the top on 2.1% and the top quarter of brands overall at 1.02%. That is a six-fold spread depending on whose accounts got measured.
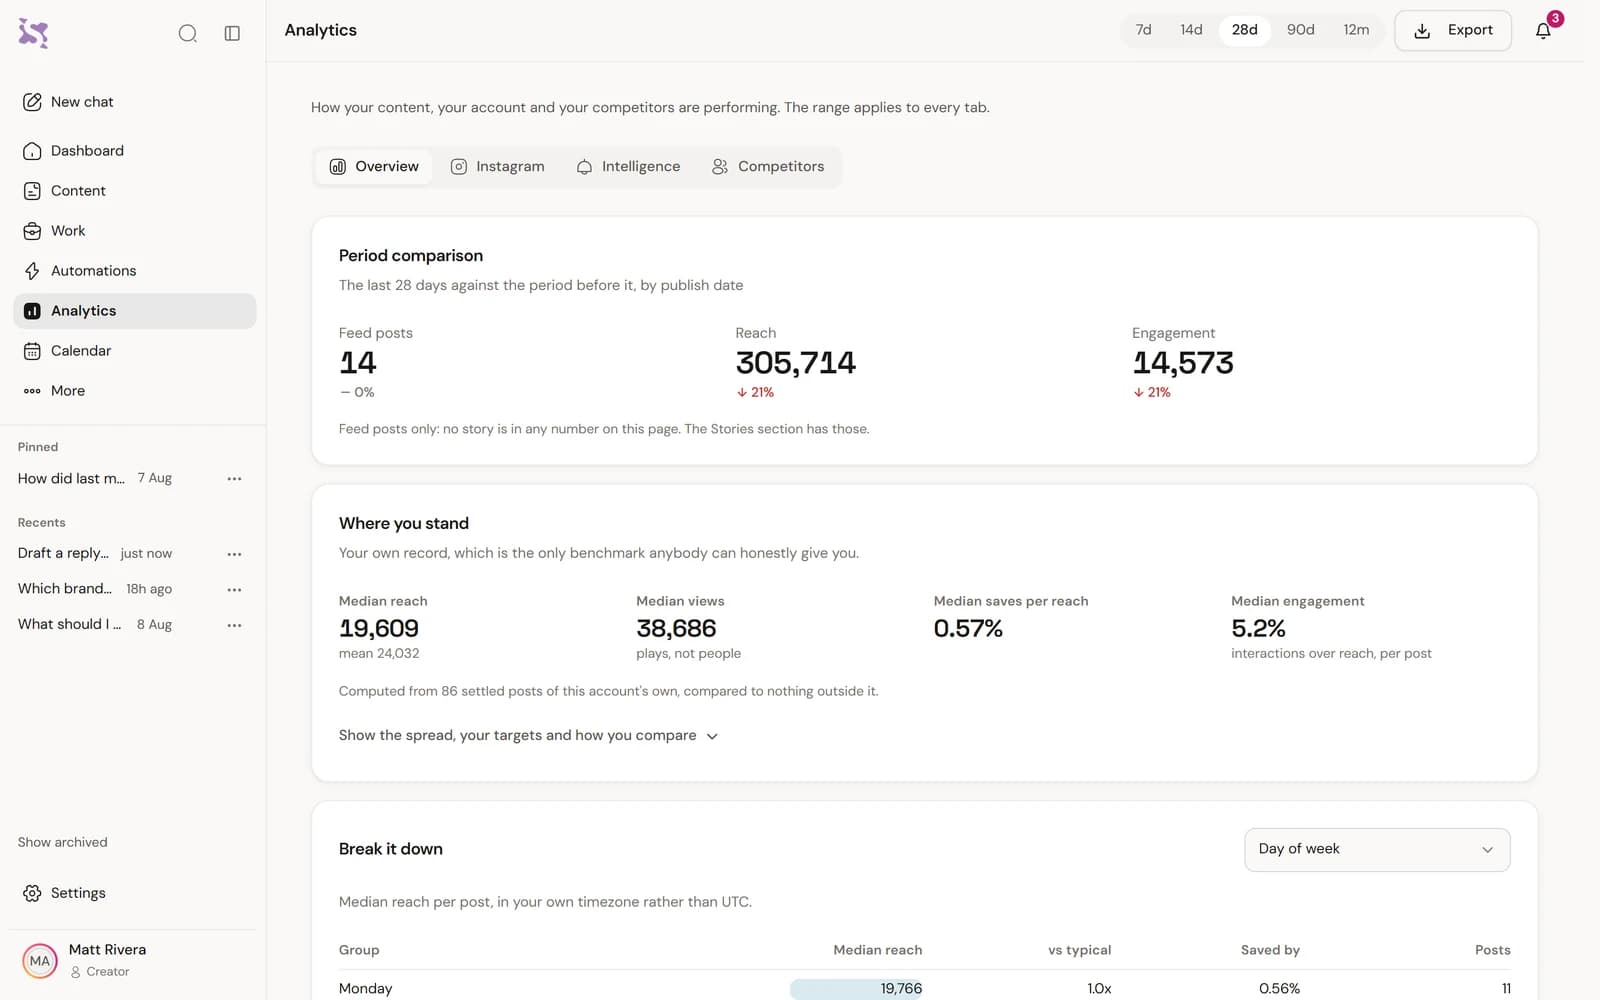
A benchmark is the middle of somebody else's accounts. Yours has a different size, a different subject, a different country and a different posting rhythm, and any one of those moves the figure more than anything you will change this month. So use your own middle post instead. Take your last twenty posts, line up their reach from smallest to largest, and take the one in the middle. That is your median, and it is the only fair thing to hold a new post against.
Use the median rather than the average, because averages get dragged around by one unusual post. Two months ago a reel did four times your normal reach: it will sit in your average for a year, quietly telling you that every ordinary week is a bad one. The middle post is immune to that.
When a bad week is only a bad week
Some weeks are down and mean nothing. Knowing which ones is the difference between adjusting and thrashing, and the reason a single post is noisy is public knowledge rather than a mystery.
TechCrunch reported in April 2024 that Instagram ranks recommendations in stages: eligible content goes to a small audience first, the pieces that group engages with go to a slightly wider audience, and the best of those go wider again. Your post's fate is therefore decided by a small first group. Who is in that group, what they had just watched, what time it was where they live: none of that is about your post, and all of it moves the outcome.
- One post is one sample. The gap between your best and worst post in a normal month is usually larger than any change you made on purpose.
- Posting time shifts who is in that first audience, and the same post at 8am and 8pm meets two different rooms.
- A holiday, an election, a cricket final or a national news event moves everybody's numbers at once and has nothing to do with you.
- Format changes the baseline. A carousel and a reel are not comparable, and comparing them produces a decline that never happened.
- Instagram runs tests continuously. Some weeks you are in one.
So the honest rule is a run of three. One post below your median is noise. Three consecutive posts below your median, in the same format, is worth investigating. A whole month below your median is a real change and you should go looking for what it was. Anything shorter than three posts and you are reading tea leaves, and you will change something that was working.
The mirror of this matters just as much. A single post that goes unusually far is also mostly luck, and the mistake people make after a good one is bigger than the mistake they make after a bad one: they rebuild their whole plan around a sample of one, and then spend six weeks confused.
What our software reads, and what it says when it does not know
This is the section about the product. Everything above works with a spreadsheet and a Friday afternoon, which is the arrangement this journal makes with you.
Synclify reads an account against its own history rather than against a published band. It keeps your posts, holds the numbers Instagram stops holding, and states what it finds as sentences: your widest posts were saved less than your ordinary ones, this format has beaten your median four times running, you have not posted in the pillar that carries most of your saves since June.
How we know: findings come in 28 kinds and every kind has a plain label, so a finding without one cannot be released.
Underneath that there are 15 views onto the same account data, from the raw dataset through to a 100 point scorecard, and you can ask for any of them in plain words. The scorecard exists because a single number is easier to act on than 15 screens, and it is a hundred points rather than a grade so you can see which part of it moved.
How we know: 15 views and a 100 point scorecard.
Questions people ask about their numbers
What is a good engagement rate?
There is no answer that survives leaving the room. Rival IQ's 2025 benchmark report puts the median across the industries it tracks at 0.36% and the strongest industry at 2.1%, which is a six-fold gap before you get anywhere near your own account. A better question is whether your rate is higher than it was three months ago on the same kind of post.
Why did reach drop when I posted more?
Reach per post and reach per week are two different figures, and posting more often usually raises the second while lowering the first. Before you conclude anything, add up the week's reach rather than reading each post. If total reach is up and per-post reach is down, nothing is broken.
Do saves matter more than likes?
For understanding your own content, yes, comfortably. A like costs the viewer nothing and a save means they intend to come back. For ranking, Instagram has named watch time, likes and sends as the top three and has not named saves, so treat saves as a read on whether your work was worth keeping rather than as a lever on distribution.
How often should I actually look at all this?
Once a week for the three, once a month for profile visits, follows-from-a-post and your median. Daily checking of anything is a habit that costs you attention and returns noise, and the follower count is the worst offender because it moves for reasons that have nothing to do with your posts.
- Meta Business Help Centre, "About Instagram Insights", read August 2026 Accounts reached is defined as the number of unique accounts that have seen your content on screen at least once; impressions as the total number of times your posts have been seen, which may include multiple views by the same account
- Social Media Today, "Instagram Updates Metrics to Focus Creators on Views", August 2024 Views became the primary metric across reels, live, photos, carousels and stories, replacing accounts reached, accounts engaged, interactions and watch time in the Insights display, with repeat views counted
- Social Media Today, "Instagram Shares Algorithm Insights To Inform Strategy", January 2025 Adam Mosseri: "The top three signals that matter most for ranking are watch time, likes and sends. So when looking at your insights, pay close attention to average watch time, likes per reach, and sends per reach."
- Social Media Today, "Instagram Chief Says Follower Counts Are Not a Good Indicator of Account Value", April 2024 Adam Mosseri's argument that creators should judge an account by reach and engagement rather than by follower count
- Rival IQ, 2025 Social Media Industry Benchmark Report Median Instagram engagement rate by follower of 0.36% across all tracked industries, higher education highest at 2.1%, and 1.02% for the top quarter of brands. The report uses medians rather than averages, drawn from companies sampled across 14 industries
- TechCrunch, "Instagram is updating its algorithm to surface more content from smaller, original creators", April 2024 Instagram ranks recommendations in stages, showing eligible content to a small audience first and widening it as people engage, which is why a single post's numbers are noisy
How we checked this
- The list of finding kinds, each with its plain label.
- The views and the scorecard the product offers.
Three more from the journal.


You have read how it works. Now watch it read yours.
Connect your Instagram and ask it one question. It reads the account first, so the first answer is about your posts rather than about Instagram in general.
Cancel any time. Every dashboard and report is free to open.